
Page 30 - Policy Economic Report - September 2024
P. 30
POLICY AND ECONOMIC REPORT
OIL & GAS MARKET
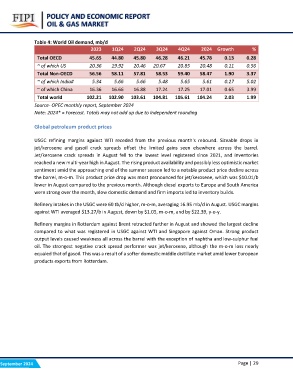
Table 4: World Oil demand, mb/d 2Q24 3Q24 4Q24 2024 Growth %
2023 1Q24
0.28
Total OECD 45.65 44.80 45.80 46.28 46.21 45.78 0.13 0.56
3.37
~ of which US 20.36 19.92 20.46 20.67 20.85 20.48 0.11 5.02
3.99
Total Non-OECD 56.56 58.11 57.81 58.53 59.40 58.47 1.90 1.99
~ of which India# 5.34 5.66 5.66 5.48 5.65 5.61 0.27
~ of which China 16.36 16.66 16.88 17.24 17.25 17.01 0.65
Total world 102.21 102.90 103.61 104.81 105.61 104.24 2.03
Source- OPEC monthly report, September 2024
Note: 2024* = Forecast. Totals may not add up due to independent rounding
Global petroleum product prices
USGC refining margins against WTI receded from the previous month's rebound. Sizeable drops in
jet/kerosene and gasoil crack spreads offset the limited gains seen elsewhere across the barrel.
Jet/kerosene crack spreads in August fell to the lowest level registered since 2021, and inventories
reached a new multi-year high in August. The rising product availability and possibly less optimistic market
sentiment amid the approaching end of the summer season led to a notable product price decline across
the barrel, m-o-m. This product price drop was most pronounced for jet/kerosene, which was $10.01/b
lower in August compared to the previous month. Although diesel exports to Europe and South America
were strong over the month, slow domestic demand and firm imports led to inventory builds.
Refinery intakes in the USGC were 60 tb/d higher, m-o-m, averaging 16.95 mb/d in August. USGC margins
against WTI averaged $13.27/b in August, down by $1.05, m-o-m, and by $22.39, y-o-y.
Refinery margins in Rotterdam against Brent retracted further in August and showed the largest decline
compared to what was registered in USGC against WTI and Singapore against Oman. Strong product
output levels caused weakness all across the barrel with the exception of naphtha and low-sulphur fuel
oil. The strongest negative crack spread performer was jet/kerosene, although the m-o-m loss nearly
equaled that of gasoil. This was a result of a softer domestic middle distillate market amid lower European
products exports from Rotterdam.
September 2024 Page | 29